Most landlords can tell you what they paid for each building. Far fewer can tell you, without opening three tabs and a calculator, how much of their portfolio they actually own today. This post walks through how Wealthru answers that question, screen by screen.
What you do without it
The usual method is a spreadsheet. One column for what you think each property is worth, one for the mortgage balance you copied from a lender statement, and a subtraction at the bottom. It works until it goes stale. The mortgage balance in the sheet is from whenever you last looked, the value is a guess you made at purchase, and a building you own with a partner is either counted in full or split by hand.
None of that is hard. It is just tedious enough that most people only do it when a bank asks.
What Wealthru does instead
Wealthru already knows two of the three things it needs, because you recorded them while running the rentals. Your mortgage sits on the property, and Wealthru works out the current balance from the terms you entered, to the cent. Your ownership shares sit on the property too, if you own it with someone else. The only thing you add is a value.
Step 1. Give each property a value
When you add a property, the Financials section asks for the purchase price and the closing date. Choose Estimate my value and Wealthru indexes that price by the Statistics Canada New Housing Price Index and shows an estimated current value. Choose Use this estimate to keep it, or Enter my own to type a figure you trust more.
The estimate is a starting point, not an appraisal, and the screen says so. If there is no purchase price, nothing is recorded and the property simply shows no value yet. Wealthru never fills the gap with a made-up number.
On Pro and up, you can later record a fresh value whenever you have one, from an appraisal, a broker opinion or a recent sale nearby. Open the property, go to the Valuation tab and choose Add valuation. Each entry is kept, so the history builds up over time.
Step 2. Read the headline on your dashboard
Once a property has a value, your dashboard leads with your real-estate equity, which is value minus mortgage, and one next action. That headline number is on every plan, including Free.
Step 3. Open the Net worth page
The Net worth page, under Money, is where the detail lives.
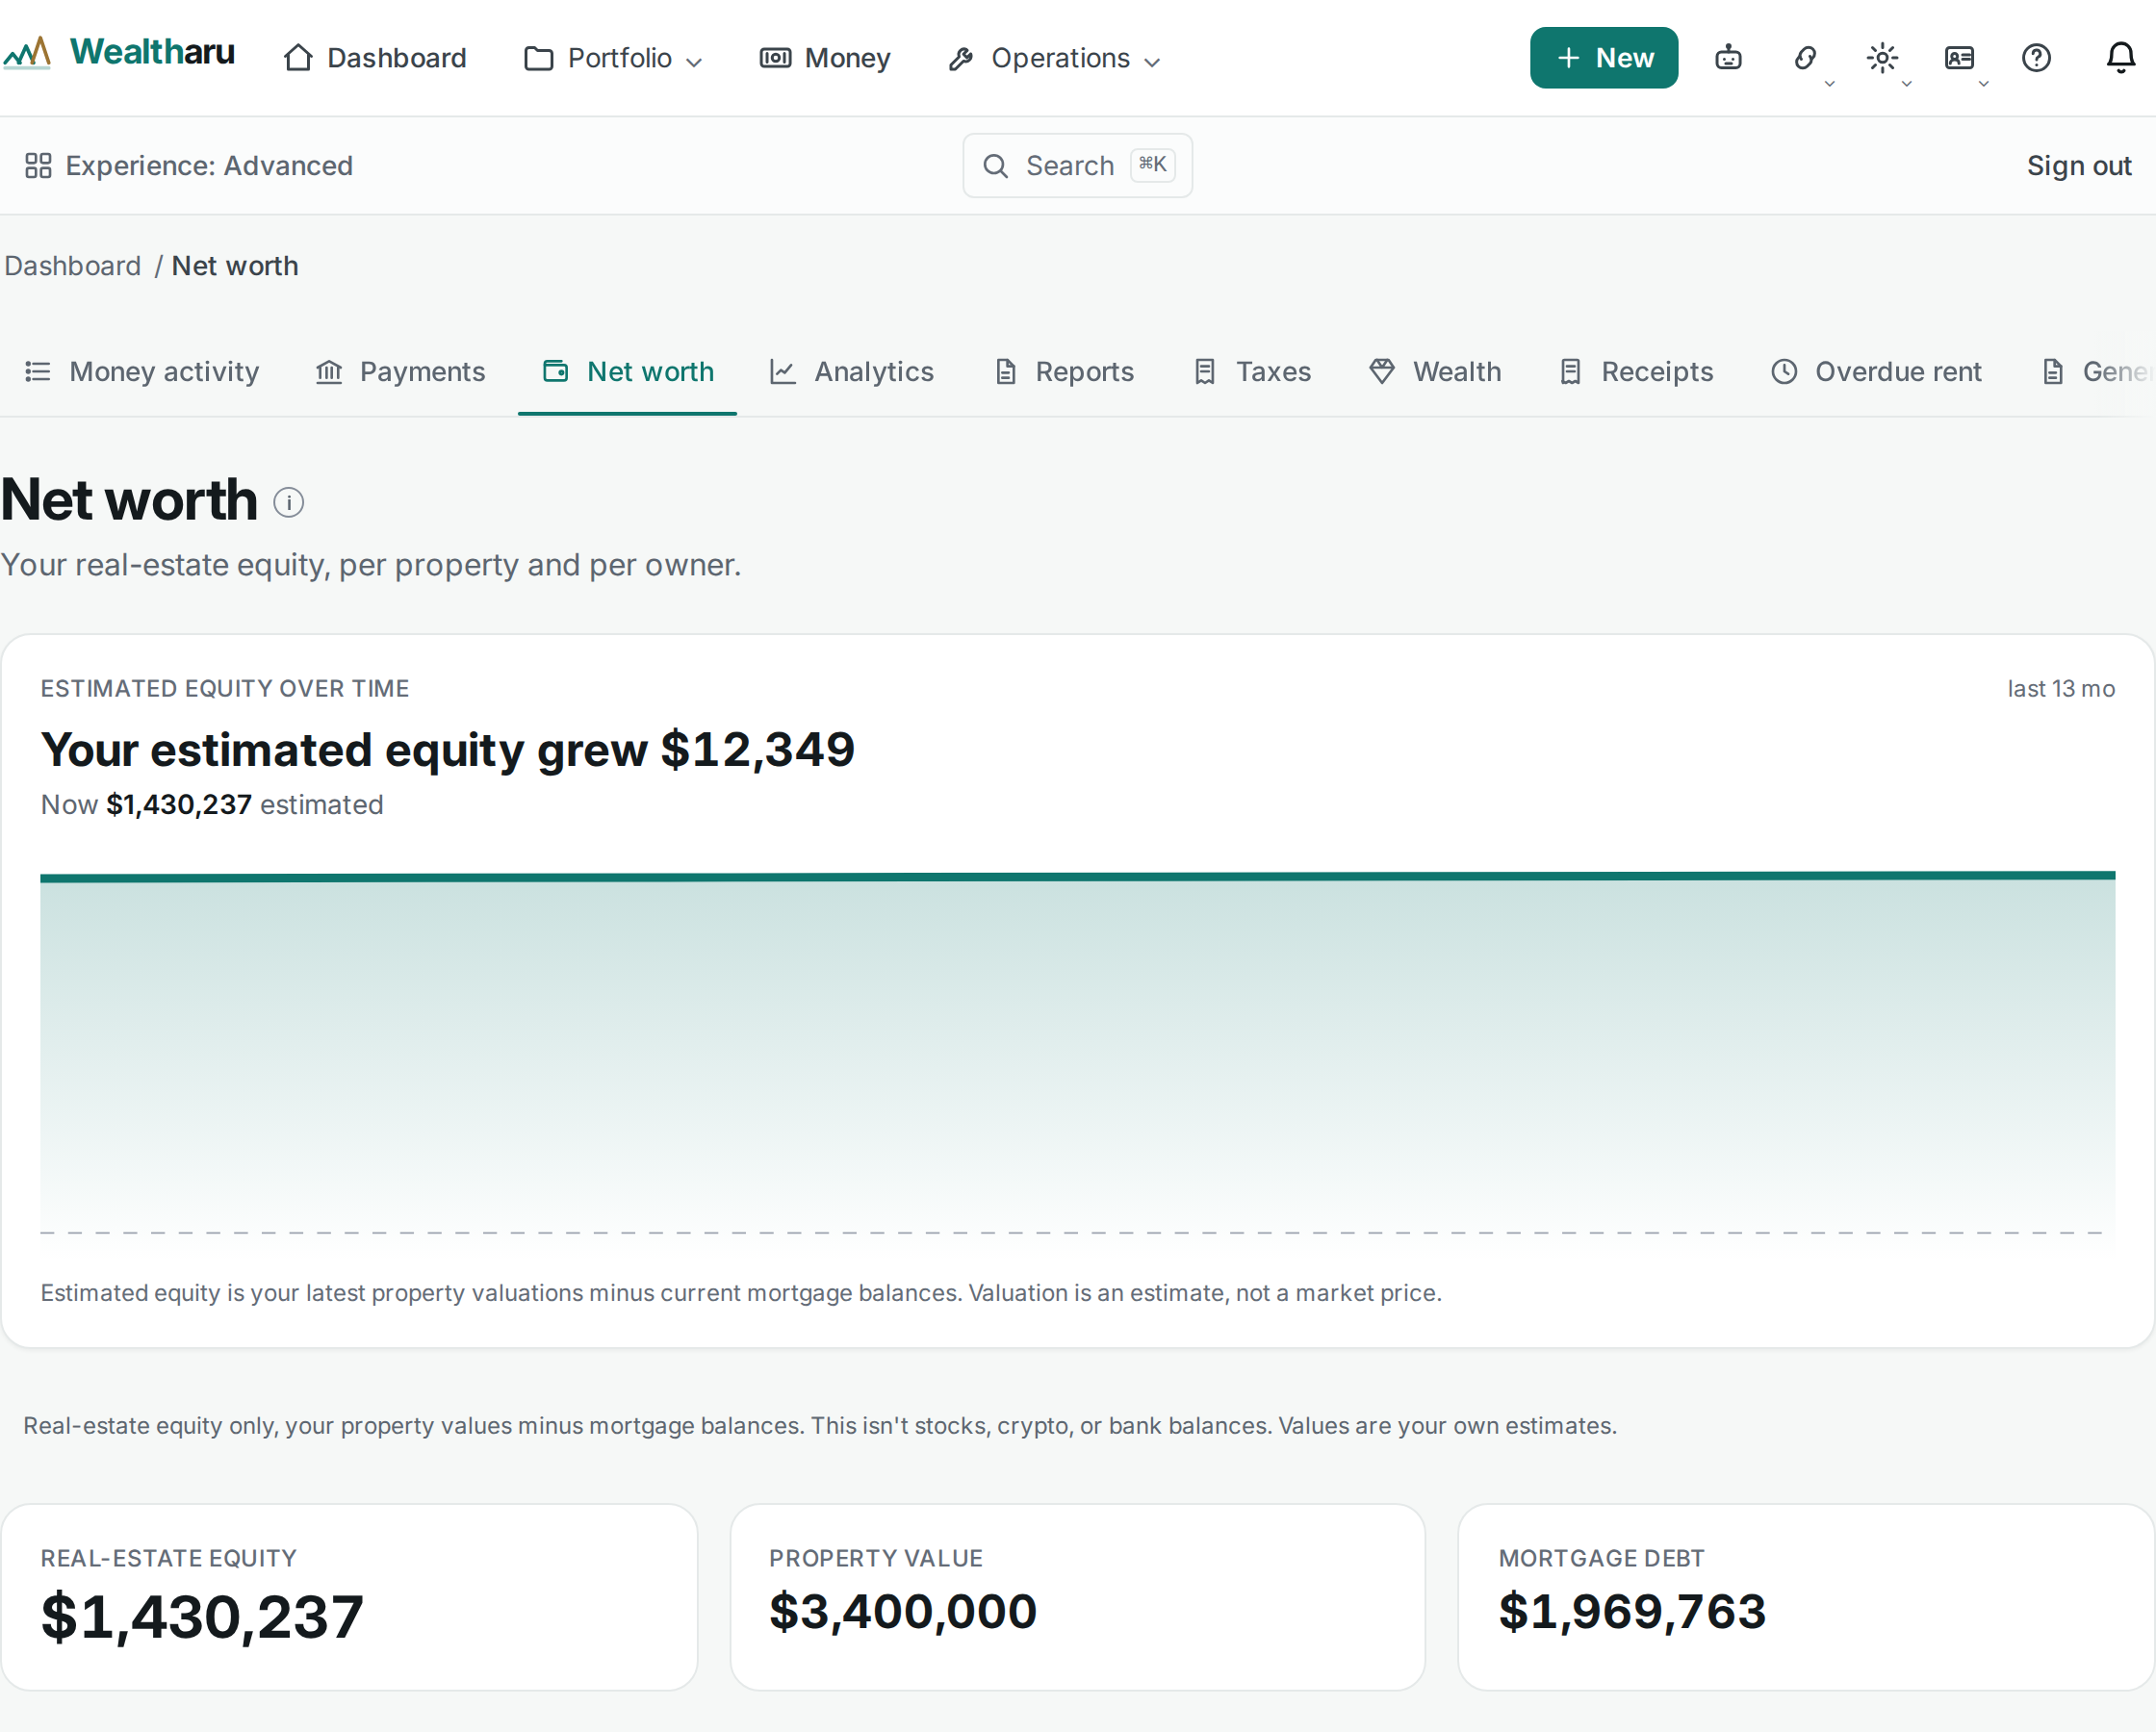
At the top is an equity trend chart with 6M, 1Y, 2Y and 3Y buttons. Every point is worked out from the valuations you recorded and your mortgage balances. Months before your first valuation show as no data, rather than as a flat zero that would make your equity look like it appeared from nowhere. When the change is small next to the total, the chart zooms in and says "Scale zoomed to this range", so you are never misled about how far the line moved.
Below the chart are the three totals: real-estate equity, property value and mortgage debt. Then come two breakdowns.
- Equity by property shows where your wealth actually sits. A property worth less than its mortgage shows as negative, plainly, rather than being left out.
- Equity by owner splits each building by the ownership shares you recorded. Any share not tied to a recorded owner is shown as unattributed, so the totals always add up.
What it deliberately does not do
This is real-estate equity only. It does not add up stocks, savings, crypto or bank balances, and the page says so in a line of its own. It is one asset class, measured carefully, which is the one most landlords have the least visibility into.
This is tooling, not financial advice.
It is also only as current as your last valuation. A chart that climbs steadily is showing you what you entered, not a live market price.
Which plan you need
The headline equity number on the dashboard is free on every plan. The Net worth page, with the trend chart, the per-property and per-owner breakdowns and valuation tracking, is part of Pro and up.
Try it
If you want the background first, our earlier article on what real-estate net worth actually is explains the arithmetic and the three ways equity grows. When you are ready, the step by step help article covers adding valuations and reading the chart, and the net worth feature page shows the rest.